Affiliate Disclosure: Automoblog and its partners may earn a commission if you purchase a plan from the car insurance providers outlined here. These commissions come to us at no additional cost to you. Our research team has carefully vetted dozens of car insurance providers. See our Privacy Policy to learn more.
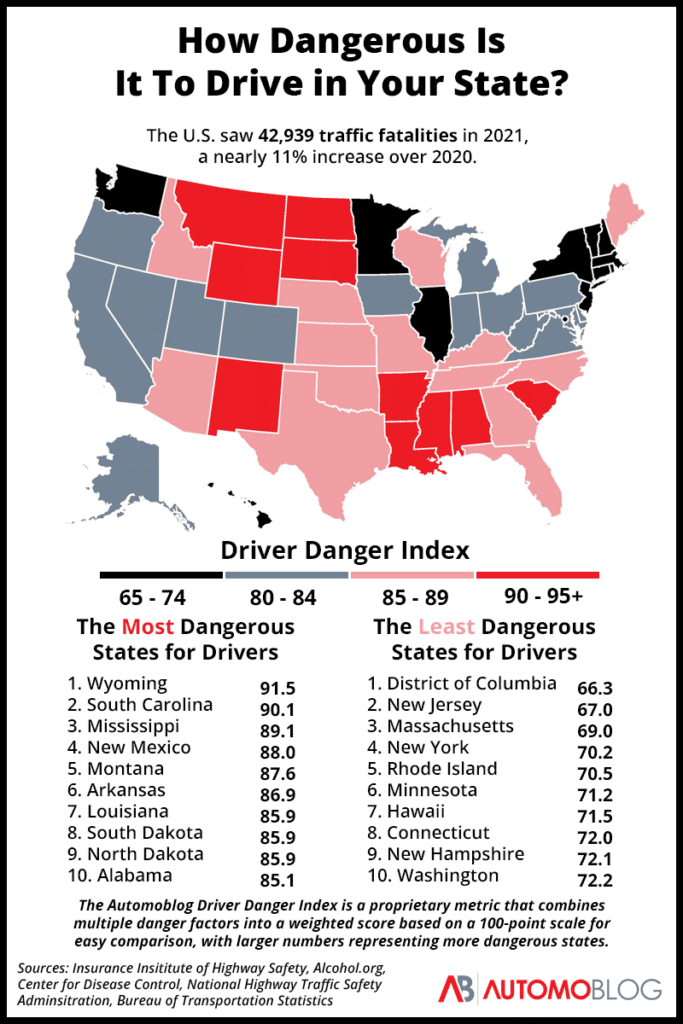
After falling somewhat steadily for decades, car accident fatality rates have started to creep back up in recent years. In 2021, the U.S. saw 12.9 traffic deaths per 100,000 people. This is a 25% increase from the all-time low of 10.3 per 100,000 people in 2014, just seven years earlier.
However, that trend has not been true for every state in the U.S., and in general, some states are safer to drive in than others. Our team wanted to identify the most dangerous states for drivers in the country, so we conducted a proprietary study using data from government studies and other sources. You’ll find the results of that study in the article that follows.
The 10 Most Dangerous States in the U.S. for Drivers
To determine the most dangerous states for drivers, our researchers combined data points from six different risk categories and weighted them to calculate the Automoblog Driver Danger Index. This metric provides a score for each state on a 100-point scale, with higher numbers reflecting more dangerous states. Based on that metric, Wyoming emerged as the most dangerous state for drivers overall.
Expand the section below to learn about our Driver Danger Index methodology in more detail.
Driver Danger Study Methodology
1. Wyoming – 91.5
Traffic fatality score: 86.7
Alcohol score: 100.0
Speed limit score: 92.0
Sleep deprivation score: 74.8
Road condition score: 99.8
Wyoming may be filled with wide-open spaces and roads to see them, but that doesn’t mean they’re safe to drive on. The state topped our list of the most dangerous states for 2023 with above-average scores in all but one category.
The Cowboy State had the highest alcohol score of any state in the country. That’s due largely to the rate of traffic fatalities involving alcohol, which is nearly double that of the national average. Wyoming also has the second-worst roads in the country according to BTS data, meaning drivers face a relatively large number of hazards while navigating the state’s highways and backroads.
2. South Carolina – 90.1
Traffic fatality score: 95.4
Alcohol score: 90.8
Speed limit score: 84.0
Sleep deprivation score: 82.5
Road condition score: 98.6
Drivers in South Carolina face some of the most perilous conditions in the country, with the state ranking second on our list in 2023. Poor road conditions and a high number of sleep-deprived residents are both major contributors to the Palmetto State’s high score on the Driver Danger Index.
However, the biggest reason for South Carolina’s place near the top of the list is its traffic fatality score – the second highest overall. The state had the most traffic deaths per million miles traveled in the country and the fourth-most deaths per 100,000 people.
3. Mississippi – 89.1
Traffic fatality score: 99.0
Alcohol score: 82.6
Speed limit score: 84.0
Sleep deprivation score: 80.4
Road condition score: 90.4
In third place on this year’s list is Mississippi. While the state has better-than-average roads for the country, it scored above the national average in every other category. It’s also one of only four states that still has a driving test waiver that allows new drivers to become licensed without a road test.
But the figure that places Mississippi squarely in the top three is its traffic fatality score. Mississippi has the highest rate of traffic fatalities in the entire U.S., with 26.2 deaths per 100,000 residents in 2021. That figure is 103% higher than the national average.
4. New Mexico – 88.0
Traffic fatality score: 89.2
Alcohol score: 87.8
Speed limit score: 92.0
Sleep deprivation score: 76.3
Road condition score: 86.7
New Mexico doesn’t have any eye-popping scores for any of our risk categories. But the state has generally high scores in the most impactful categories – enough to make it the fourth most dangerous state in the U.S. for drivers. New Mexico is in the top 10 for both its traffic fatality score and speed limit score. The state’s alcohol score is in the top five for the country.
5. Montana – 87.6
Traffic fatality score: 91.2
Alcohol score: 85.9
Speed limit score: 88.0
Sleep deprivation score: 66.8
Road condition score: 96.6
Drivers in Montana don’t have to worry as much about sleep-deprived drivers compared to most other states. However, in every other risk category, the Treasure State is well above the national average.
Montana placed within the top 10 for its traffic fatality score, alcohol score, and speed limit score. Its maximum speed limit of 80 on rural interstates is the highest in the country, increasing the risk and severity of accidents on those roads.
6. Arkansas – 86.9
Traffic fatality score: 94.6
Alcohol score: 80.1
Speed limit score: 84.0
Sleep deprivation score: 77.8
Road condition score: 98.8
Sitting in sixth place on the list of the most dangerous states for drivers is Arkansas. The state scores higher than the national average in every category and is home to some of the poorest-quality roads in the U.S.
But it’s the state’s traffic fatality score that pushes the Bear State into the top 10 overall. Arkansas has the third-highest traffic fatality score in the country, placing just behind Mississippi and South Carolina. The state averages 21.2 traffic fatalities per 100,000 people – 70% above the national average.
7. Louisiana – 85.9
Traffic fatality score: 88.7
Alcohol score: 80.0
Speed limit score: 88.0
Sleep deprivation score: 87.0
Road condition score: 91.8
Louisiana is home to some of the country’s best food and music – as well as some of its most dangerous roads. The Pelican State’s scores are above average in every single risk category except for road conditions, which actually rank among the 20 best in the country.
Louisiana ranks within the top 10 states for its traffic fatality score, with 17.8 automotive accident deaths per 100,000 people. It also ranks sixth overall for its alcohol score. While the state is in the middle of the pack as far per-capita alcohol consumption is concerned, it ranks in the top 10 for alcohol-related traffic fatalities.
8. South Dakota – 85.9
Traffic fatality score: 83.0
Alcohol score: 77.3
Speed limit score: 100.0
Sleep deprivation score: 66.2
Road condition score: 96.1
South Dakota’s scores in most categories are below average. With the lowest alcohol score of our top 10, it also ranks in the bottom 10 states overall for sleep deprivation, meaning exhausted drivers aren’t a major concern compared to most states.
But South Dakota does have the highest speed limits in the entire country. The maximum limits for both rural and urban interstates is 80 miles per hour. That means that high-speed – and therefore, high-risk driving – is a factor on most of the state’s major roadways.
9. North Dakota – 85.9
Traffic fatality score: 75.3
Alcohol score: 91.0
Speed limit score: 92.0
Sleep deprivation score: 75.7
Road condition score: 99.8
North Dakota and South Dakota ended up with the exact same Driver Danger Index score. However, they got that score for different reasons.
Whereas maximum speed limits were the main contributor for South Dakota’s place in the top 10, it’s mainly a combination of a high alcohol score and some of the worst roads in the country that got North Dakota there. North Dakota ranks second overall for its alcohol risk. The state also ranks third for its road conditions, just behind Tennessee and Wyoming.
10. Alabama – 85.1
Traffic fatality score: 84.6
Alcohol score: 85.5
Speed limit score: 84.0
Sleep deprivation score: 76.6
Road condition score: 98.3
Alabama rounds out the top 10 most dangerous states for drivers in 2023. The Yellowhammer state only ranks inside the top 10 for one category – alcohol risk. And, its sleep deprivation score is just below the national average.
However, generally high scores in all other categories contribute to a high overall score for Alabama. Those scores are bolstered by the state’s top 10 alcohol score, owing mainly to a high rate of traffic fatalities involving alcohol. Alabama saw 5.5 alcohol-related traffic deaths per 100,000 people in the data we analyzed from the CDC, more than all but five other states in the country.
Automoblog Driver Danger Index: Full List
Expand the section below to see the full list of states ranked by Driver Danger Index score.
For more content like this, check out our list of the most expensive states to own a car.