Affiliate Disclosure: Automoblog and its partners may earn a commission when you use the services or tools provided on site. These commissions come to us at no additional cost to you. See our Privacy Policy to learn more.
Commuting can be a challenge no matter where you live – but urban sprawl, local geography, a lack of city planning, and other factors can make the drive to and from work particularly painful in specific locations.
In 2021, the average American worker spent 52.6 minutes per day commuting round-trip, according to data from the U.S. Census. And while that equates to nearly four-and-a-half hours per week, or 225 hours per year, that’s just the average. Drivers in many cities have it much worse. Our research team used the 2021 Census data to identify the top 10 U.S. cities with the worst commutes.
Drivers in These U.S. Cities Have the Worst Commutes
Driving to and from work isn’t fun anywhere, yet there are some areas of the country where conditions may seem custom-made for nightmarish gridlock. We used a number of data points to create a “Commute Hardship Score” that reflects the overall difficulty of a commute in each city on a 100-point scale.
Drivers in the following 10 cities hopefully have a lot of music or podcasts they enjoy listening to, because they’ll need something to fill some of the worst commute times in the country.
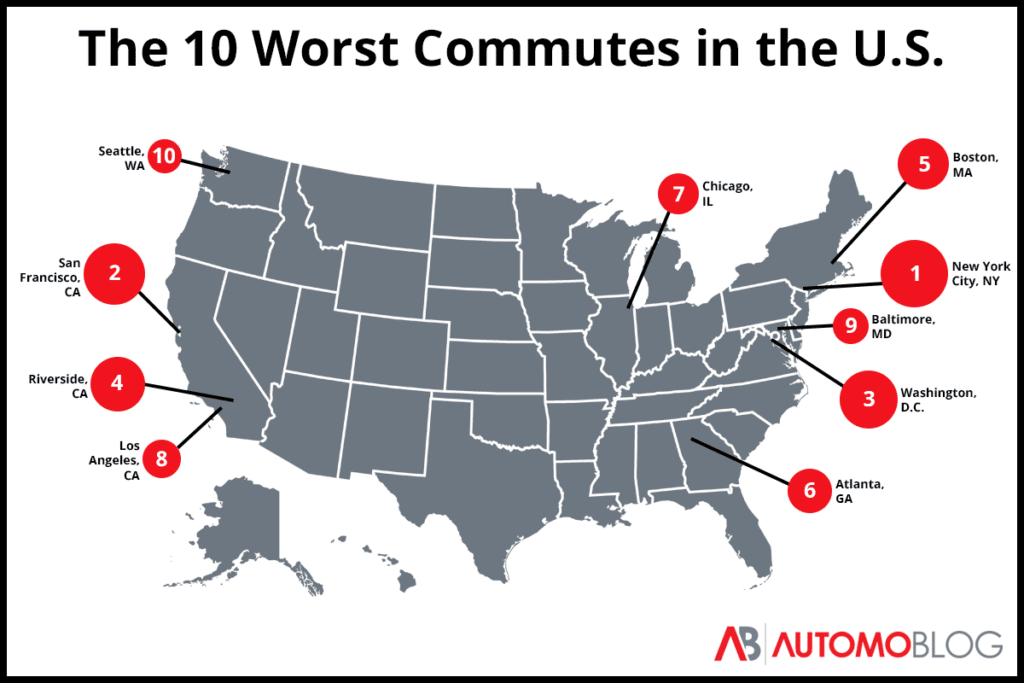
1. New York City, New York
Commute Hardship Score: 95.7
Drivers in and around The Big Apple probably won’t be surprised that the New York City metropolitan area landed in the top spot on this list. At 33.7 minutes each way, drivers in and around the five boroughs face the country’s longest average commute. The New York City metro area also claims the largest share of commuters traveling over an hour each way at 22.7%.
Within Manhattan, First Avenue North is one of the major pain points for drivers. However, within the metro area, the Brooklyn-Queens Expressway section of I-278 is perhaps the biggest source of frustration for commuters in and around New York City.
2. San Francisco, California
Commute Hardship Score: 87.9
San Francisco and the Bay Area at large ranks second in the list of the worst commutes in the U.S. One major reason for this is simple geography. Much of the city’s commuter population lives on the east side of the San Francisco Bay, with only three bridges available for crossing over – resulting in frequent bottlenecks.
On average, Bay Area-drivers spend 35.2 minutes each way commuting, with 19.4% traveling over an hour to and from work.
While slow-moving traffic is present throughout San Francisco, the city’s bridges are some of the biggest chokepoints in the area. On a daily basis, the San Francisco-Oakland Bay Bridge in specific can be host to jams that make the roads look more like parking lots than major thoroughfares.
3. Washington, D.C.
Commute Hardship Score: 87.7
The nation’s capital is known for many things, such as its world-class museums, stunning architecture, and distinct local culture. But anyone who has attempted to drive in or around Washington, D.C. also knows the city for its distinctly tedious traffic. A sizable portion of the city’s workers travel in and out of the city daily from suburbs in Maryland and Virginia, resulting in rush-hour congestion that can extend more than 50 miles outside of city limits.
On average, drivers in the D.C. metro area spend 35.6 minutes each way heading to and from work, with 18.3% commuting over an hour in each direction.
Drivers can find themselves at a standstill at nearly any point along I-95 within a few dozen miles of D.C. However, I-395 between the George Washington Parkway and Washington Boulevard is home to some of the worst traffic not only in the city, but in the entire country.
4. Riverside, California
Commute Hardship Score: 84.4
It may seem odd to some that Riverside appears before Los Angeles on the list of cities with the worst commutes in the U.S. However, residents of the city – which claims the third-highest rate of car ownership in the country – and Riverside commuters know the perils of the traffic here well. While it isn’t as populated as its more famous neighbor to the west, nearly 85% of the city’s working population reported commuting to and from work by car alone, resulting in some of the country’s worst rush hours.
Riverside-area drivers travel 33.9 minutes in each direction on their commutes, with 18.4% of them traveling over an hour.
Drivers can find themselves idling at any point along the Riverside Freeway, as it serves as one of the main arteries in and out. However, Riverside’s worst traffic typically occurs where that freeway intersects with I-15.
5. Boston, Massachusetts
Commute Hardship Score: 79.4
Drivers in Boston have it rough, to say the least. According to some, “rush hour” can start as early as 6AM and extend as late as 7PM most days of the week. And it’s not just rush hour that drivers have to fear. The Boston Celtics, New England Patriots, Boston Red Socks, and the Boston Bruins may have won enough to make “Titletown” an appropriate nickname for the city, but the fans swarming the stadiums can make traffic unbearable at almost any time.
Bostonians spend an average of 32.6 minutes on each leg of their commute, with 15.6% of them taking more than hour per journey.
As those familiar with Beantown can tell you, traffic on the Southeast Expressway portion of I-93 regularly grinds to a halt. But drivers heading north out of the city towards Cambridge and Somerville via Route 28 consistently face Boston’s worst congestion.
6. Atlanta, Georgia
Commute Hardship Score: 78.0
Thanks to a healthy job market and booming economy, Atlanta is now one of the country’s fastest-growing cities, home to more than six million people. Unfortunately, that means that commute times are growing just as quickly. Nearly 75% of Atlanta residents report commuting to work in their car alone, making for jam-packed roads around rush hour and over the weekends.
The average commute in and around Atlanta is 32.5 minutes each way. Around 14.2% of workers spend more than an hour getting to and from their jobs.
Spaghetti Junction – a major interchange of I-85 and I-285 – might have a fun-sounding name, but it’s often anything but for people trying to navigate it. Heavy-duty truckers going into Atlanta and around it can easily jam up roads at any time of day. However, this chokepoint is no match for the Downtown Connector, a 7.5-mile stretch at the convergence of I-85 and I-75 that’s often considered one of the worst bottlenecks in the U.S.
7. Chicago, Illinois
Commute Hardship Score: 77.9
On many days, the breeze might be the only thing moving in the Windy City during rush hour. Chicago is home to some of the country’s most magnificent museums, one of its most exciting culinary scenes, and unfortunately, some of its worst traffic. The grid pattern that the city is built on helps to manage some of the flow in the urban core.
However, workers from Chicago’s many suburbs can find themselves bumper-to-bumper on their way to and from work. The average commuter in the Chicago area takes 32.4 minutes getting to and from work, with 14.4% of them traveling more than an hour in each direction.
The intersection of I-94 and I-90 is frequently ranked among the country’s most congested roads, as Chicago also serves as a transportation hub for the region. Other major interchanges, such as where I-94 and I-80 meet, are also frequently backed up.
8. Los Angeles, California
Commute Hardship Score: 76.5
The only surprise with Los Angeles appearing on this list is that it didn’t rank any higher than eighth place. Snarling traffic jams are a fixture of depictions of LA in movies and television shows, but it ranks third among California metropolitan areas in terms of how rough the average commute is. Still, locked-up traffic in and around Los Angeles isn’t just Hollywood fiction.
Extensive urban sprawl and the country’s second-largest population means lots of cars on the road at most times of the day. The average commuter in and around Los Angeles spends 31.7 minutes each way getting to and from work, with 14.4% spending more than hour.
While the city as a whole may not top the list of the worst commutes, the section of the I-5 Highway between Euclid Avenue and the 605 Freeway was rated by the INRIX Global Traffic Scorecard as the single most congested road in the U.S. in 2021.
9. Baltimore, Maryland
Commute Hardship Score: 75.6
Baltimore is the fourth city from the I-95 corridor to make the list of the worst commutes in the U.S. Even though the city’s urban population has been in decline over recent years, the population in the surrounding areas of Howard and Anne Arundel counties has grown. That means there are more cars on the road trying to get in and out of the city – and getting between you and one of those legendary crab cakes.
Workers in the Baltimore area spend an average of 31.7 minutes each way getting to and from their jobs. Around 13.3% of them spend more than an hour on each leg of their commute.
Baltimore drivers tend to hit the worst traffic along I-695, also known as the Baltimore Beltway. As one might expect, congestion is also common along I-95 both north and south of the city.
10. Seattle, Washington
Commute Hardship Score: 74.7
Rounding out the top 10 list of the worst commutes in the U.S. is the Seattle area. Traffic problems in and around the city can be blamed, in part, on how it developed. The city of Seattle was formed by joining independent land claims and later, a series of annexations. As a result, the city’s road system could be generously described as a disjointed grid, with lots of one-way streets and hills that can make navigating a challenge even for longtime residents.
The average commute for workers in the Seattle area is 31.6 minutes each way. Nearly 12.5% of them commute more than an hour in each direction.
The I-5 rears its ugly head again as a major point of congestion, this time as it passes through Seattle’s downtown. However, the worst traffic in the city is on Denny Way between Fairview Avenue and First Avenue – but at least drivers in that standstill have the Space Needle to gawk at.
How We Determined Our Rankings
Our research team ranked cities based on our custom Commute Hardship Score metric. This proprietary metric factors in data from the 2021 U.S. Census 1-Year ACS Estimates, including the average commute time and share of commuters traveling more than 60 minutes in each city.
To more accurately reflect the data points in context with averages for the set, we normalized the figures over a standardized range. We then combined these figures into an equation, weighting each factor based on its impact to commuters, resulting in a grade based on a 100-point scale.